
Analytics
Run it on numbers,
not gut feeling
Check conversation volume, response times, tag distribution, and per-agent performance by period. Even what percentage auto-response resolves and how satisfied customers are shows up in numbers.


From conversation volume to automation results and customer satisfaction—it's all measured.
What gets measured can be improved.
Not a screenshot
The charts you will see in the console, rendered live
Daily conversations
LiveVolume by hour
Who answered, tags, satisfaction — see your support data as graphs.
What's included
Period-based conversation metrics
Volume, new customers, daily trends
AI self-resolution rate
Track the ratio of conversations finished automatically
Top conversation tags
See inquiry-type distribution at a glance
VOC score
Derive satisfaction by analyzing the conversation
Per-agent performance
Throughput and response flow per member
Getting started
Your team's day on a dashboard
New conversations, new customers, customer messages, AI responses—what happened with your team today comes together on one screen. Switch the period across 7, 30, or 90 days to read the daily conversation trend and new-customer flow. Whether a peak season is coming or passing shows up in the graph first.
How far auto-response resolves
In the resolution breakdown, see the ratio of conversations AI finished on its own versus those an agent stepped into. The self-resolution rate rises as you reinforce training, and that much of your team's time comes back. You can prove the results of automation with metrics, not just a feeling.

Which inquiries keep your team busy
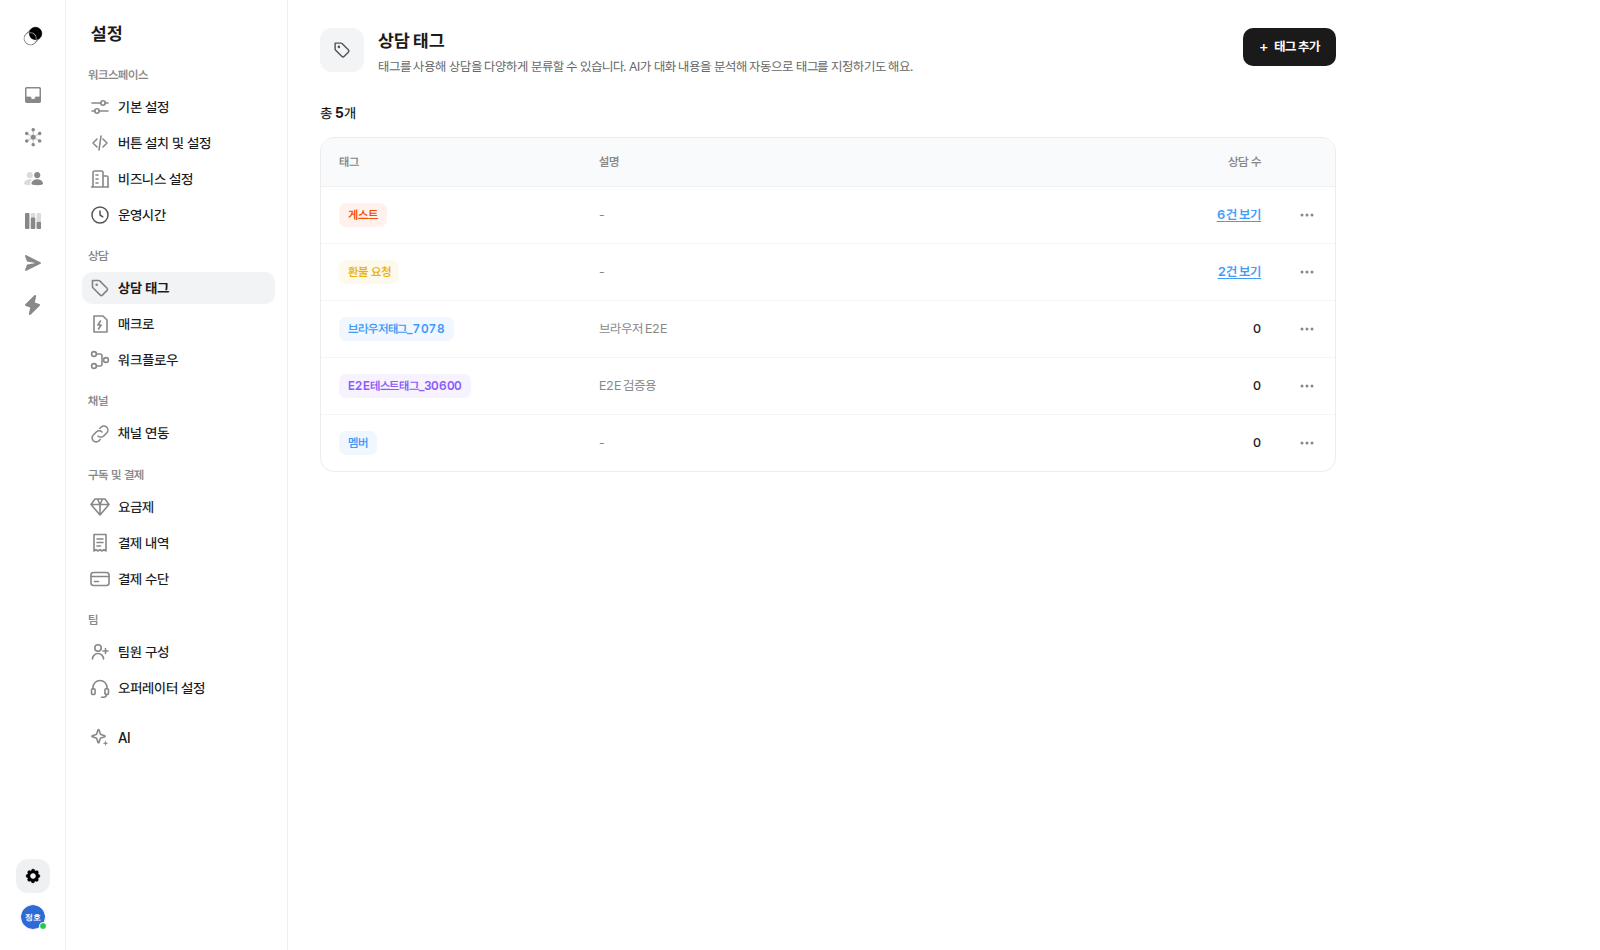
Check the most-assigned tags for the period under Top Conversation Tags. If refund requests are rising, it's time to revisit the policy; if questions cluster around a certain product, it's time to bolster the FAQ. The tag distribution becomes your team's priority map.
Satisfaction without surveys, via VOC score
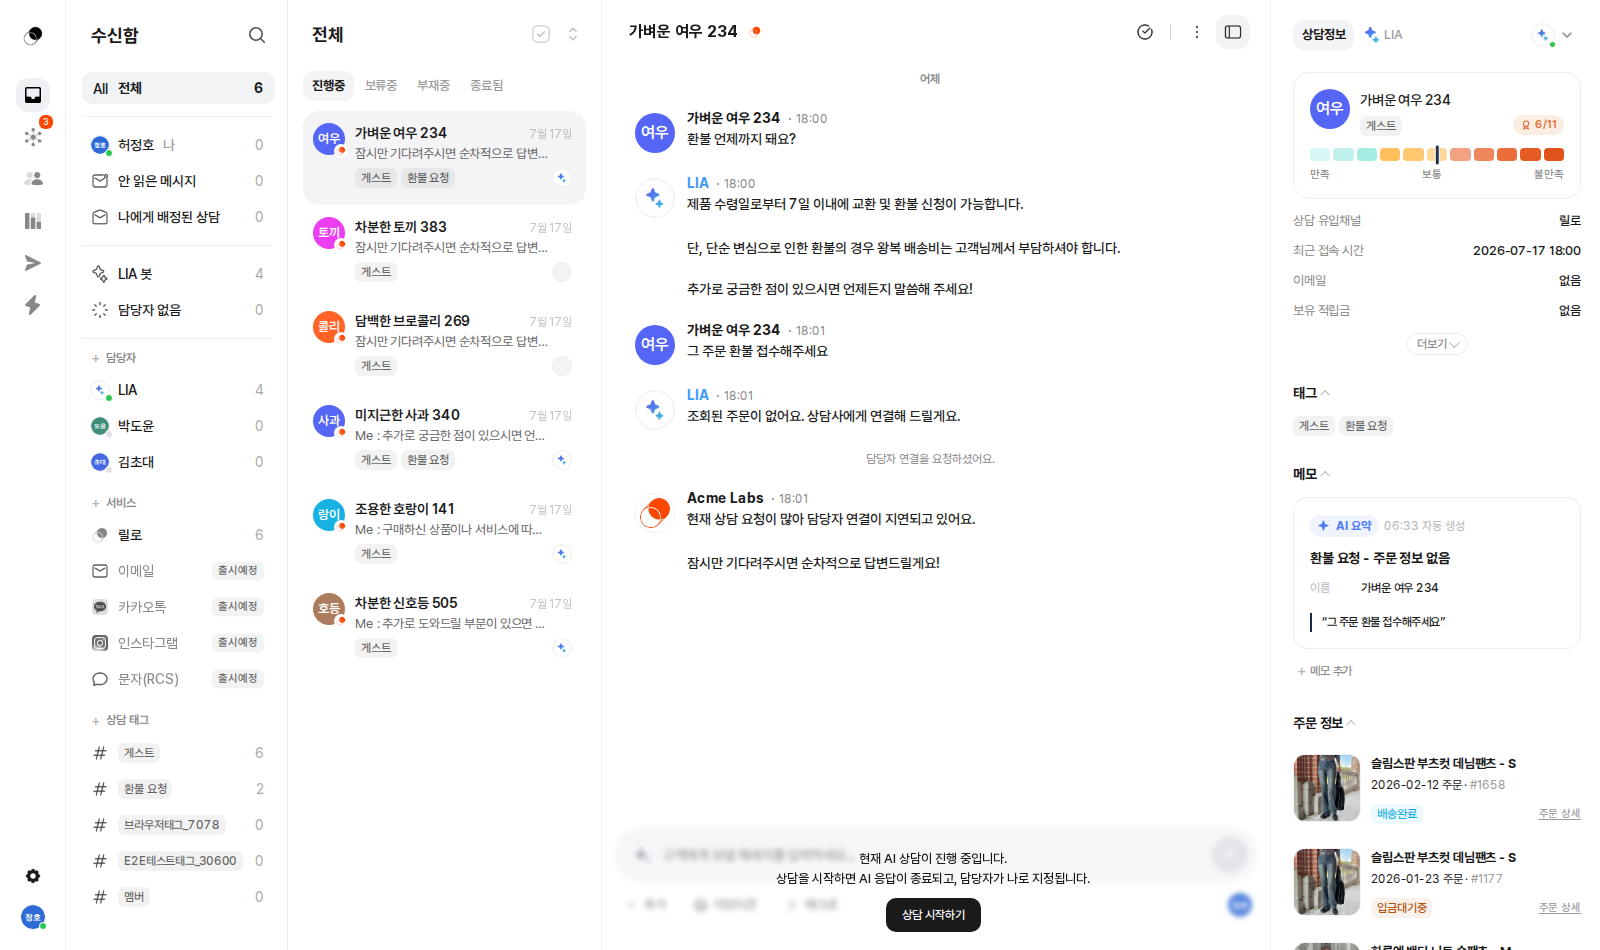
Only a handful of customers answer surveys. Lillo analyzes the conversation itself to derive a VOC score for customer satisfaction on every conversation. Instead of low-response-rate surveys, every conversation becomes data—and you can catch signs of mounting frustration before the conversation even ends.
Per-agent performance, made transparent
In the agent performance report, review each member's throughput and response flow. Workload distribution and evaluation—once done by gut—now happen on top of data. It's the starting point for turning your top performers' methods into the team's methods.
Enough explaining.
The fastest way is to try it yourself
Setup takes just five minutes — hand your first conversation to LIA today.